AI workstation · Ep. 3
First Boot: The Sleep Trap, the Watchdog, and the Health Monitor
The machine arrived. I plugged it in. First boot was clean — Windows 11, the HP Z2 firmware handled the Ultra 7 and the RTX PRO 5000 without drama, nvidia-smi showed driver 595.79 and CUDA 13.2, and the 48 GB of VRAM was visible. I loaded Ollama, pulled Qwen 3.8 27B, ran a test prompt. Tokens came out. All good.
Then the machine went to sleep.
Not “standby” sleep. Not “hibernate” sleep. Something worse. I came back an hour later and the box was cold to the touch, the fans were off, and nvidia-smi timed out. I checked the power settings: sleep was set to “Never.” I checked the Wi-Fi power management: “allow the computer to turn off this device” was unchecked. I rebooted. It worked again. Then it slept again.
What was actually happening
powercfg /a told the truth:
The following sleep states are available on this system:
    Standby (S0 Low Power Idle) Network Connected
    Hibernate
    Fast Startup
This machine uses Modern Standby (S0 Low Power Idle), not the classic S3 “sleep” that the Control Panel sleep slider actually controls. With Modern Standby the CPU enters a low-power state, the Wi-Fi radio (Intel BE200) can power down even when the OS says “stay connected,” and the box looks off but isn’t technically in any state Windows is tracking. The power button is on the front of the tower — I couldn’t reach it without getting up, and the box was behind a desk.
The fix was three layers:
1. Kill the sleep path. I disabled the Wi-Fi power-management “allow the computer to turn off this device” setting and added a powercfg registry override so the S0 state never engages when the machine is plugged into power. The command:
powercfg /setdcvalueindex SCHEME_CURRENT SUB_SLEEP STANDBYIDLE 0
powercfg /setacvalueindex SCHEME_CURRENT SUB_SLEEP STANDBYIDLE 0
powercfg /setactive SCHEME_CURRENT
2. Keep the network alive. Even with S0 disabled, the Wi-Fi driver was still dropping the link under load. I set the adapter’s power management to “Never” and disabled the Intel BE200’s “Power Save Mode.” The Tailscale tunnel now stays up.
3. Wake on LAN — the part that took the longest. The machine had no Ethernet cable; only Wi-Fi was up. HP Z2 firmware has a “Wake on Ring” option but no standard WoL for Wi-Fi-only setups. The working fix: a scheduled task with “Wake the computer to run this task” enabled, triggered every 5 minutes during the hours I expect the machine to be on. Combined with the Tailscale tunnel, I can now wake it from my phone or laptop without touching the box.
The watchdog
Even after the sleep was fixed, services died. Ollama would crash after a bad model load. ComfyUI would OOM on a large image. The Gateway would hang after a long-running inference. Task Scheduler’s “restart on failure” only fires for processes it saw fail — a process that segfaults silently or gets killed by OOM doesn’t trigger it.
So I wrote C:\Users\admin\watchdog\watchdog.ps1. It runs every minute as a scheduled task. It checks 8 services:
| Task | Port | Kill list |
|---|---|---|
| OllamaServe | 11434 | ollama.exe, llama-server.exe |
| Gateway | 5050 | (path match) |
| PrivateAIApp | 3939 | (path match) |
| PublicAIApp | 4040 | (path match) |
| PublicGujAIApp | 4041 | (path match) |
| ComfyUI | 8188 | (path match) |
| PdfWerkApi | 5272 | — |
| CloudflaredTunnel | — | cloudflared.exe |
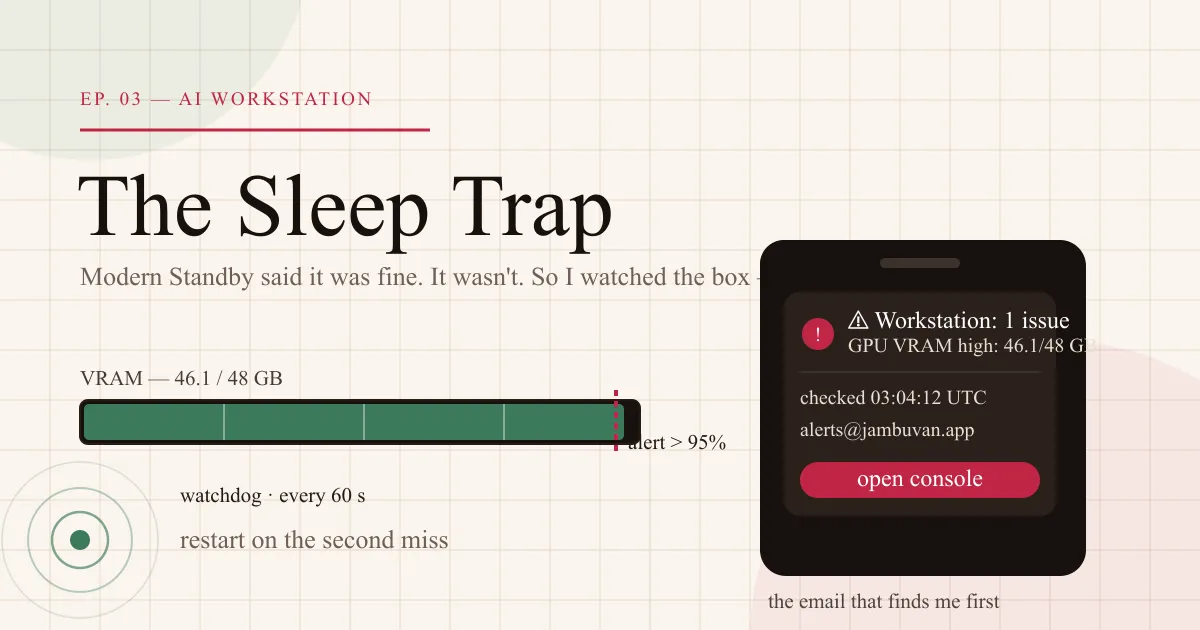
Each check is: is the port listening (or the process running)? If not, increment a counter. Second miss → kill any leftover processes and Start-ScheduledTask. Seventh consecutive miss → give up and log “Check its log.” This prevents a crash loop from hammering the box.
The log caps at 1 MB and keeps the last 2000 lines.
The health monitor
The watchdog keeps services alive. It doesn’t tell me anything.
C:\Users\admin\health-monitor\monitor.js is the one that emails me. It runs as a separate scheduled task (HealthMonitor), and does:
- Port check on the same 5 ports (11434, 8188, 5050, 3939, 4040)
- URL check on
https://chat.jambuvan.appandhttps://private-ai.jambuvan.app(catches the cloudflared tunnel being down) - Process check for
cloudflared.exe - GPU VRAM check via
nvidia-smi— alerts if >95 % used - Disk space check — alerts if <50 GB free on C:
If anything fails, it sends an email via Brevo (sender: alerts@jambuvan.app, to: joshihrn.it@gmail.com) with the list of failures and a timestamp. There’s a 1-hour cooldown so a flapping service doesn’t spam me, and a recovery email when things come back.
The Brevo API key is read from C:\Users\admin\private-app\data\brevo_key.txt at runtime. No secrets in the script.
What I got out of it
- The machine doesn’t go to sleep anymore.
- If a service dies, it’s back within 2 minutes without me knowing.
- If a service can’t come back, I get an email on my phone.
- If the GPU is about to OOM, I know before the inference fails.
- If the disk is getting full, I know before the models can’t write.
The setup took about a day of trial and error. Most of it was the sleep trap — the other stuff was straightforward. The sleep trap is the part I’d tell anyone setting up a Modern Standby Windows box in a room they don’t sit near: check powercfg /a first, and if it says S0 Low Power Idle, the sleep settings in the UI are a lie.
What’s next
The box is awake, watched, and loud enough to email me when it’s not. Next is putting the actual work on it: the first local inference runs, and wiring the services behind episode 2’s “12 models in the local library” into one endpoint Jambu can call. That is episode 4: first local inference.